Sunday, September 25, 2011

The Great Pemuda Street Water Caper of 2011

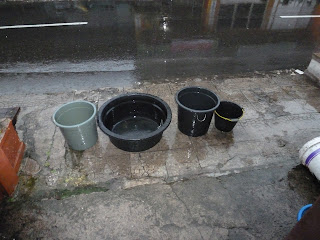
It was a dark and stormy night.  The small room was atwitter with the pitter pitter of rain falling on metal, the drops coalescing into rivulets in the ridges of the corrugated tin roof.  Steady streams of water flowed from the gently sloping roof into the buckets beneath, arrayed strategically to capture the maximum amount of fluid from the ephemeral cloudburst.  The residents of 13 Pemuda street, dwelling there for differing degrees of temporariness, smiled; the next day they would be able to bathe and flush the toilet.


The Water Crisis

For the past three months water has been a problem at my temporary residence, the home of my good friend Agung.  The crisis started due to the unusual dryness of the dry season.  A general lack of even the most minute amounts of precipitation affected Sungai Penuh and the entire Kerinci Valley region.  By the end of the holy month of Ramadan, Pemuda street was being served daily by a water truck, which made deliveries which were then carried by residents in buckets into their respective homes.
The improvised tap
A couple of weeks ago water was restored, but for some reason none made it into the pipes supplying the houses on the north side of the street (including Agung's).  Since the truck was no longer coming daily, this posed a significant problem for half the street.  Repeated complaints to the water board went unheeded and the problem was only solved when one unidentified resident uncovered the feeder pipe to the south side houses and grafted in a tap.  Soon a system of turn-taking arose among the residents of the north side, who daily filled buckets at the improvised tap.

Everything was going fine for several weeks until two days ago.  I was sitting on the curb waiting for our buckets to fill (usually a half-hour operation), reading patiently when two gentlemen pulled up on a motor-bebek.  I soon learned that they were from the water board.  Evidently site of one of the four foreigners in the region filling buckets from an unauthorized, and more importantly unmetered tap had drawn the attention of the authorities.  Soon they learned from other residents what was going on.

"You
Adding a tap.  The helmet is obviously for safety.

shouldn't take water from that tap", one of the men said to me.  "It's stealing".

"I see.  Do you have a word in Indonesian for when a public utility refuses to respond to customer complaints arising from said utility's failure to provide for a basic human need for 3 months?" I responded.

"Hmmmmmm....." said the water man, walking away. 

The watermen immediately went to work.  Somehow within 15 minutes water was restored to the main pipe (1) feeding the north side of the street, but with insufficient pressure to pump the water up the one meter required to make it into our bak mandi (2).  They then installed a plastic tap outside the front door at ground level just past our water meter so we could fill buckets and then empty them into the bak mandi.  They achieved this with a can of wet-dry cement and a hacksaw blade (only the blade).  Then they went to work on the improvised tap.  They had a length of polybutylene pipe they were going to use to rejoin the line sans the tap.  One of the men asked us for some old newspapers.  In a feat of ingenuity that puts my tightfisted old Highland landlord to shame, he used the newspapers to build a fire on the sidewalk and used it to heat the plastic pipe so it could be bent to the required angle to fit the line (3).  Then they went on their merry way. 
Yours truly and the 3-bucket system

Now Agung and I are served by a thin trickle of water from about 10am to 12pm every day.  During this time we connect a hose to the tap and collect buckets of water to fill the bak mandi and an additional storage tub.  We've devised a three bucket system with a syphon, but it still takes about two hours due to the rate at which the water flows.  During this time I read and dream of archimedes screws and ram pumps, and realize that my knowledge of pre-industrial hydraulic genius is lacking.  When it rains fairly heavily we can collect 20 gallons or so in about an hour from the roof.


The Geography of Water

The whole water crisis has been an interesting experience for me, because I've always lived in areas where water was abundant.  The two-hour-a-day has led me to think a bit about a resource that most people take for granted, though.  The availability of water is really a geographic phenomenon; aside from the physical location of water, which in many cases helps determine what sorts of human activities will take place in a given location, availability of water also affects human potential in that the more time you spend looking for water, the less time you can devote to other activities.  Clean, freely flowing water is a luxury in many parts of the world.  The map below shows the percentage of the population in different parts of the world that have access to clean water.  Can you notice any spatial trends?


Photo from Clean Water for the World
In parts of Africa, where more than 300 million people lack access to clean water, it is unheard of.  What's more, in many places the burden of collecting water falls unevenly on the backs of women.  In some parts of Africa, women walk up to ten miles daily in search of water.  In seasonal tropical climates this distance can double in the dry season, when ephemeral streams dry up.  According to Water Aid, the journey is often rife with danger, and the source of water is often polluted.  What's more, water containers are heavy, and along with the health problems associated with the dirty water many women suffer back problems from hauling the water over such distances.

The provision of clean water is, in theory at least, a global priority.  Access to safe water is part of several of the much-publicized Millennium Development Goals, including those involving improving sanitation and ending hunger.  Numerous NGOs and multilateral organizations have programs to improve access to water, but there is still a lot to be done.  Below I've included some facts about water from various sources.

  • 400 million children (one in five in the developing world) has no access to safe water (UNICEF)
  • Unsafe water and sanitation cause about 4,000 child deaths per day (UNICEF)
  • 80% of all sickness is tied to lack of access to safe water (WHO)
  • 2.1 million people per year die of diarrhoeal diseases, 88% of these are linked to unsafe water (WHO)

Picture of the day...

From HippoRoller site
I shamelessly lifted today's picture from the internet.  I came across it when I was looking for facts and maps about water.  The HippoRoller is a neat invention that promises to ease the burden of transporting water long distances and possibly alleviate some of the health problems stemming from hauling water long distances. 

Notes

1.  The "main" pipe is 1/2 pvc

2.  The bak mandi is a stone or concrete reservoir found in the bathroom in Indonesian residences and businesses.  You draw water with a dipper from the bak mandi to manually "flush" the squat toilet and wash your hands.


3.  I will never forget this trick and have a strong sense that it will someday come in handy. 


For Further Reading:

For a closer look at water crises around the world, check out this great graphic from the BBC. 
Tuesday, September 20, 2011

Amphibians, the Environment, and Kerinci Seblat National Park

Amphibians are remarkable creatures.  They spend part of their lives in water and part of their lives on land.  They were the first land-based vertebrates (backbone-having) creatures to evolve millions of years ago.  Several characteristics of amphibians make them very much dependent on their geography, as we'll discover in today's post. 

For starters, amphibians do not regulate their own body temperature, like humans and other mammals can.  They are what scientists call thermal conformers.  The outside temperature is very important for amphibians because it plays an important role in many of the body processes of amphibians, including how much oxygen they take in, their heart rate, how they move, their digestive system, how fast (or slow) they develop and grow, and how well their immune system functions.  This makes them very sensitive to temperature changes in the external environment.  It also ties many species of amphibians to a particular area with certain environmental characteristics (niche).  These types of species have limited dispersal abilities, which means that it's hard for them to find new homes and to spread to new areas. 

The Wide World of Amphibians...

Cartogram from Wake and Vredenburg.  See references.

The cartogram (1) above shows the distribution of amphibian species around the world.  As you can see, many of the countries with the most amphibian species are in the tropics.  This mirrors a general pattern of biodiversity for most kinds of plants and animals.  A good rule of thumb is the closer to the equator you get, the greater the biodiversity there is.  From the cartogram we can see that Indonesia has a lot of amphibian species (between 251-450 species).  Now let's look at another cartogram.

Cartogram from Wake and Vredenburg.  See references.

This second cartogram shows the distribution of amphibian species discovered between 2004 and 2007.  As you can see, Indonesia is a hotspot for new discoveries.  The interesting thing about this is that the number of described amphibian species has increased by about 50% over the past 20 years; in others words more than 2000 of the now-known 6300 or so species has only recently been discovered!  Thus we can assume that Indonesia has many more species waiting to be discovered.  But the question is, for how long? 

Threatened Amphibians

Diagram from Blaustein, et al.  See references.
Over the past several decades, scientists have noticed that lots of species of amphibians have gone extinct, and that many others are threatened (2).  In fact, a worldwide assessment of amphibians indicates that one-third or more of the 6300 described species of amphibians are threatened with extinction!  Another study says that the current rate of amphibian extinction is about 211 times the background extinction rate.  The background extinction rate refers to the number of extinctions there should be just in the course of natural evolution.  However, there is a significant amount of debate over the cause or causes of the extinctions and declines.  Below I've summarized a few of the factors that have been suggested to play a role.

The introduction of alien species.  Alien species are those that are brought intentionally or unintentionally to a new habitat where they did not originate.  In some cases the alien species is able to out-compete the native species that naturally exist in the area.  Sometimes the invasive species preys upon the naturally occurring species as well (3).  One example affecting amphibians on the continental US is the introduction of lake trout for recreational fishing.  The lake trout feed on tadpoles, thus affecting frog populations.

Over Exploitation.  This simply means that people use too many of the species in one way or another.  Historically demand for frog legs as a delicacy has caused big declines in frogs in many places. 

Land Use Change.  This is another factor that is easy to understand; it simply refers to the way that people change the landscape.  When we clear forests to make farms or to build settlements, it leaves less habitat for many types of animals, including amphibians.

Global Warming and associated changes.  Over the past few decades it has become increasingly clear that people are altering the Earth's atmosphere.  One change involves the amount of UV radiation that makes it to the Earth's surface.  UV is a type of high-energy radiation from the Sun.  This is what causes sunburns on your skin.  Our atmosphere filters out most of the UV radiation, which is fortunate for us because UV is very dangerous to humans (and other animals).  However, human-caused pollution has altered the atmosphere's ability to block our UV rays, and so more UV reaches the Earth's surface than before.  Amphibians appear to be especially susceptible to the effects of UV radiation. 

A bigger problem, though, is global warming.  The changes we have unintentionally made to the atmosphere is causing the planet to warm up gradually.  Over the next century or so scientists predict that the average global temperature will increase by 3-7 degrees.  While this might not sound like much, it will have tremendous impacts on local environments.  One really good example of this can be seen on mountains.  If you've ever climbed a mountain (think of Mauna Loa or Haleakala) you've probably noticed that it gets colder as you go up.  On these high mountains it gets so cold you have to put on a heavy coat!  You may have also noticed that the amount of moisture changes as you go up.  From a geographic perspective, what you've noticed is that you pass through several climate zones on the way to the top of the mountain (4).  Each of these climate zones has different collections of plants and animals; there are different ecosystems adapted to the specific climate conditions.  This variability was first described in the 19th century by uber-geographer Alexander Humboldt, who wrote about the different types of agricultural activity taking place with increasing elevation in the Andes Mountains (look for a future post on this topic; I've included a diagram on the left to give you an idea how it works).  Now, think about the effects of global warming.  As the whole planet warms up, these different climate zones should move up the mountain, shouldn't they?  But there is only so far they can go.  If it warms up too much the climate zones will basically slide off the top of the mountain, disappearing forever.  If this happens we lose the species associated with those climate zones (5).   Now let's think about the example of amphibians.  We already learned that they are closely tied to their natural environment.  This includes not only the climate but the land on which they live.  When the climate zone moves up the mountain away from the land they are used to, it makes it harder for the amphibian species to survive.
Diagram from Sodhi, et al (see references)


More Pesticide Use.  Pesticides are artificial chemicals farmers use to kill farm pests.  They also use fungicides, herbicides, and a host of other chemicals to increase crop productivity.  The problem is that once these chemicals get into the natural environment (often via runoff or wind) they sometimes have unexpected consequences.  Chemicals may weaken amphibians, making them less successful in reproduction and development, or they may affect other parts of the food webs that amphibians depend on. 

Emerging Infectious Diseases.  There are numerous instances of amphibian declines being partially attributed to new or introduced diseases.  One of the main culprits is a fungal pathogen with the intimidating name of Batrachonchytrium Dendrobatidis, or Bd for short.  As habitats get opened up diseases are able to spread to new populations.  They are also spread by humans and other invasive species.  Many scientists are worried that increased temperatures will help the spread of diseases too. 

So as you can see there are a number of possible causes for amphibian declines and extinctions.  The reality, though, is that it is probably a combination of these factors at work.  Different studies tell different stories.  One recent study indicates that small range size is the most important factor, followed by body size of the amphibian.  Small ranges make amphibians more susceptible to habitat destruction, but they also increase the risk posed by extreme weather events like droughts and hurricanes, which may possibly be increases in part due to increased global temperatures.  Body size is an important variable because the bigger the animal is, the longer it takes it to grow and develop and hence recover from disturbances which kill off part of the population.  But there are other studies as well.  Part of the problem is the complex interrelationships between factors working at the local level and those operating at global scales.  For example, one study argues that El Nino, a global climate event, leads to decreased snow in the Oregon Cascade mountains.  Since the snow pack is not as thick, there would be less water when the snow melts in the spring, making streams and lakes shallower.  The Western Toad breeds in these water bodies in the early spring, and so because there is less water protecting the eggs they are exposed to higher levels of UV radiation, resulting in increased infection and death due to water mold.  Fascinating, isn't it?  It's like trying to fit together the pieces of a mystery or solve a puzzle.

Amphibians and Kerinci Seblat National Park

Huia modiglianii

What does all of this have to do with Kerinci Seblat National Park?  Well, it's simple really.  KSNP is a huge protected area that encompasses many different habitats and ecosystems.  A recent inventory of herpetofauna (amphibians and reptiles) was conducted over several years to determine exactly what kind of amphibians are out there in the park.  The study encompassed 14 survey sites across a variety of altitudes (50m-2000m) and general habitat types, including hilly cultivated land, highland hill forest, lowland hill forest, marshland, edificarian (near houses and gardens), flat cultivated land, secondary hill forest,
Limonectes laticeps

and heavily degraded forest.  The study found 70 species of frogs, 4 of which had never been described before!  This study was the largest of its kind ever in Kerinci, but there is still a lot of work to be done.  The results show that the park, which is most known for its tigers, has other important species of note.  These amphibians are important because, like we saw above, they are particularly sensitive to changes in the environment.  That means that if you monitor the amphibians, you might be able to get some clues about threats to the environment before they get too severe.  The amphibian census also potentially indicates small areas in the park which could be targeted for strict conservation.  This would enable park managers to c
Megophrys nasuta
hannel their scarce resources where they are needed the most.  KSNP is a huge park, and it faces a lot of pressures.  So anything that can help managers do their jobs better is very useful. 

The photos of frogs are from Kurniati's inventory of amphibians for KSNP. 

Notes:

(1)  Cartograms are neat cartographic data-visualization tools.  They exaggerate the size of the country, making it bigger or smaller to illustrate the magnitude (size) of the particular variable in question.  Can you find some more cartograms on the internet?  What types of things to they indicate?

(2) Scientists have noted a general trend of extinctions and decreasing diversity among many types of animals, but amphibians seem to be experiencing greater than average declines and extinctions. 

(3) Can you find some examples of invasive species in Hawai'i?  What native species have they affected and how?

(4) Geographers classify climates on the basis of two characteristics: temperature and precipitation.

(5)  Many species on mountains are unique, because mountains function as "islands" for plants and animals.  What I mean by this is that they are isolated areas where populations of creatures evolve without contact with other populations, and so they rapidly diverge from other species.  Think back to my post on the Wallace Line and the example of snails in Hawai'i.  Do you see how the isolation of a mountain top could serve as a barrier for a species?  The Hawaiian silverswords are a good example of this. 


References and Further Reading

Blaustein, Andrew et al.  2011.  The Complexity of Amphibian Population Declines: Understanding the Role of Cofactors in Driving Losses.  Annals of the New York Academy of Sciences 1223 pp108-119.

Blaustein, Andrew, Susan Walls, Betsy Bancroft, Joshua Lawler, Catherine Searle, and Stephanie Gervasi.  2010.  Direct and Indirect Effects of Climate Change on Amphibian Populations.  Diversity 2, pp281-313.

Collins, James, and Andrew Storfer.  2003.  Global Amphibian Declines: Sorting the Hypotheses.  Diversity and Distributions 9, pp89-98.

Kurniati, Hellen.  2008.  Biodiversity and Natural History of Amphibians and Reptiles in Kerinci Seblat National Park, Sumatra, Indonesia, 2005, 2006, 2007.  Cibinong, Indonesia: Research Center for Biology, LIPI.

Rohr, Jason, and Thomas Raffel.  2010.  Linking Global Climate and Temperature Variability to Widespread Amphibian Declines Putatively Caused by Disease.  Proceedings of the National Academy of Sciences v107#18.

Sodhi, Navjot, et al.  2008.  Measuring the Meltdown: Drivers of Global Amphibian Extinction and Decline.  PLOS One v3#2.

Wake, David, and Vance Vredenburg.  2008.  Are We in the Midst of the Sixth Mass Extinction?  A View from the World of Amphibians.  Proceedings of the National Academy of Sciences Vol15 Supplement 1.

Friday, September 9, 2011

Indonesia's Wallace Line and an Introduction to Biogeography

Poster from Science-art.com
"In the archipelago there are two distinct faunas rigidly circumscribed, which differ as much as those in South America and Africa and more than those of Europe and North America.  Yet there is nothing on the map or on the face of the islands to mark their limits.  The boundary line often passes between islands closer than others in the same group  --Alfred Russel Wallace, 1858 in a letter to his friend Henry Walter Bates.


Alfred Russel Wallace is often described as a "naturalist".  He lived from 1823 to 1913, a time when many of the principles guiding our understanding of the world and its natural processes were being formulated.  Wallace went on expeditions around the world; he suffered malaria and dysentery on his quest for knowledge and several times nearly lost his life.  But his real contributions would stem from his time in the islands that would eventually become known as Indonesia.

Alfred Russel Wallace explored the Malay Archipelago from April 1854 to April 1862.  During that time he collected thousands upon thousands of specimens and described hundreds of new species.  He was fascinated by the diversity of species in Indonesia.  He was startled to find dozens of species of trees, butterflies, and other creatures within close proximity to one another.  The diversity of species was far beyond that in his native England, and what he found challenged conventional understandings of where creatures come from.  Among these diverse creatures, though, Wallace found similarities, and reasoned that many of the species he encountered must be somehow related.  What complicated his hypotheses, though, was the existence of a stark contrast in species composition between the eastern and western parts of the archipelago.  In the words of Van Oosterzee (see reference below),

In Borneo Wallace found monkeys, wild cats, civets, otters, squirrels, but in Sulawesi he found few monkeys, but lots of cuscuses.  In Sulawesi there were honeyeaters and parrots, but in Borneo there were oriental birds like woodpeckers, barbets, trogons, fruit thrushes...

The two sides are divided by what would eventually become known as the Wallace Line (1).  Wallace had to figure out what was going on here.  What was responsible for these incredible variations in floral and fauna between islands that in some cases were only a few kilometers apart?

Wallace is often considered the father of a burgeoning sub-discipline of geography called biogeography.   Wallace was the first scientist to realize that the distribution of related species is fundamentally linked to the geologic history of the places the species inhabit.  Biogeographers study physical geography in an attempt to understand how species are distributed.  Biogeography is based on the principles of evolution and natural selection that were first elucidated by Charles Darwin and the aforementioned Alfred Russell Wallace. A proper discussion of the theory of evolution is beyond the scope of this blog, but for our purposes here a couple of basic principles will suffice:

1.  There is random, natural variation within species.  This simply means that through time, a given species will change bit by bit.  You can see this in humans.  Even though as a species we are very closely related to one another, there are all sorts of differences between people.  We have different skin tones, eye color, hair color, body types, etc.  All of these differences are types of mutations that occurred during the several-million-year evolutionary history of humans!  The same thing happens with other species as well.  Think about all the different types of dog you see.  They are all the same species (canis familiaris), but between the different breeds there is a lot of variation. 

2.  This random variation can be passed down through generations.  Even though the variation is random, it can be passed down from generation to generation because the information responsible for these variations is encoded in genes.  This is why you share many of the same traits as your parents!  In the aforementioned example of dogs, people take advantage of this tendency for traits to be inherited to breed dogs of certain types. 

3.  New traits that confer an advantage will be more likely to be handed down, whereas traits that are disadvantageous are less likely to be passed along.  I like to think of these variations as nature's laboratory.  Right now nature is performing millions upon millions of experiments on living things!  Sometimes the new trait might help a critter live longer or cope with its environment better.  In this case, the critter is more likely to find a mate and have children.  But in some cases the new trait might cause problems for the critter, which would make it more likely to be eaten by a predator or befall some other unfortunate case.  If this happens, it's less likely that the new trait will be passed along. 

Photo from Hawaiian Tree Snail Conservation Lab at UH
The unique contribution of Wallace was to show that the lay of the land matters in these processes of evolution and speciation.  So in addition to the aforementioned basic principles we can add a couple of correlaries:

1.  Species that are somehow divided into subpopulations will begin to diverge, and the rate of divergence depends in part on how frequently the populations interact with one another. 

Like Indonesia, Hawai'i is a great place to study biogeography.  One fascinating example of the effect of the natural environment on the evolution and radiation of species comes from the many varieties of tree snails that inhabit our archipelago.  When the snails arrived in Hawai'i long ago, there were no predators, and so the random, natural variation we spoke of earlier ran rampant.  The snails were able to spread all over the island.

This is where changes in the landscape come in.  Have a look at the two topographical maps I've included below.  The first is of the Big Island, which is the youngest island in the archipelago.  It's actually still growing.  The second map is of Oahu.  Can you notice any differences?


Even though these maps are of slightly different types, you should be able to see some differences between the two islands.  Oahu is marked by valleys running out of the Koolau and Wainae mountain ranges.  Manoa, Makua and Palolo are just two examples; there are dozens of others, and you're probably familiar with at least a few of these.  These valleys are carved by wind and water, the forces of erosion.  The oldest part of Oahu is a little more than 3 million years old, and so mother nature has had a long time to work her magic on the island.  The island has been dissected by water and wind, leaving a roughness to the terrain.  The Big Island, on the other hand, doesn't have nearly as many valleys (though there are a few), and though the mountains are higher, the terrain is a lot smoother. 

Now let's think about the islands from a snail's perspective.  Remember our islands have emerged from a hot spot (TK) in the middle of the ocean, and so when they emerge from the sea they are barren with no creatures.  They are also very far from any other land masses (think of how long it takes to get anyplace on a plane!) which could be potential sources for colonizing creatures.  Thus there are significant obstacles for any plant or animal to make it to Hawai'i, and throughout the millions of years that the islands have been here only a few managed to make the journey.  The tree snail was one of the lucky ones.  When the tree snail arrived millions of years ago, it likely disembarked on an island like the Big Island: expansive with fairly smooth terrain.  It would have been easy for the snail to spread across this island.  Combine this with the fact that there were no predators and you have a true snail paradise!  I've created a diagram below to give you an idea of what it might look like (please note that the snails are not to scale):


As you can see, the snails are free to roam and interact.  They are pretty much all a part of the same population, and so the random variation gets shared between them because they are able to breed with one another.  We can think of the Big Island as being like this.  However, as years pass and erosion sets in, natural obstacles like valleys and ridges are worked into the landscape, as you can see from the diagram below.  This diagram is a model for an older island, like Oahu or Kaua'i.


On the older island, the initial population of snails gets broken up into smaller populations, each isolated from one another.  What this means is that if a new trait emerges in one of these smaller populations it will be shared within that population only, but not with the other populations.  So eventually the different populations will begin to diverge and will eventually reach the point where they are completely different species!

Wallace was the first to understand how natural geologic processes could affect the evolution and divergence of species, but he made his observations in the context of Indonesia.  His "line" traces a division rooted tens of millions of years in the past when the configuration of continents was very different than today.  The variation in species reflects the varying origins of the various islands in the Indonesian Archipelago.  The islands of the western part of Indonesia have a very different history from those of the eastern part, and the island of Sulawesi is a different story all together!  Look for a future post on how the islands of Indonesia have actually moved across the face of the earth.

(TK)  If you are not familiar with the way the Hawaiian Islands form, you can do a google search for "Hawaiian Island formation" or "volcanic hot spot".  The Hawaiian Center for Volcanology is a good place to start.  The Bishop Museum in Honolulu had a really good exhibit on the hot spot as well.

References: Van Oosterzee, 1997.  When Worlds Collide: The Wallace Line. Ithaca, NY: Cornell University Press.  220pp.

Thursday, September 8, 2011

We're Gonna Blow A 50-Amp Fuse!

Today on my second day back in Indonesia I encountered a demonstration (demo) outside the headquarters of the Corruption Eradication Commission (KPK) on Jalan Rasuna Said in central Jakarta.  I was just walking down the road when I happened onto the demonstration, so I stuck around in hopes that the protest would degenerate into a riot and I'd get a chance to witness some tear gas, water cannon, and rubber bullet action, since that kind of stuff would be pure gold on YouTube.

It turns out that the protestors were upset with Indonesian president Susilo Bambang Yudhoyono (SBY), vice-president Budiyono, and former finance minister Sri Mulyani over their alleged involvement in a scandal known as the Bank Century affair.  I'm quite interested in Indonesian politics and current events, and so I decided to ask around as to what was up.  After all, Sri Mulyani, who is currently managing director at the World Bank, is widely regarded as a brilliant economist of unshakeable integrity and a possible candidate to be the next president of the Republic of Indonesia.  Sri Mulyani's straightforward manner has won her the respect of Indonesia watchers around the world, so I was curious to learn about her "dark side", because up until now all I've heard is good things about her.   

So I asked some of the several hundred protestors that had been bussed in to central Jakarta for the occasion.  All the protestors were young folks, and so at first I thought they might be college students.  "What's going on here?  Why are you guys upset with Sri Mulyani for?"

"Because she's a corruptor!" came the answer from several different people.

My efforts to ask the question in several different ways, along with my prodding for elaboration ended in vain.  So I tried a different angle.  "What do you guys want the KPK to do about it?"

"We want her brought down!" was the standard response.

"But you know she's at the World Bank now, right?  The KPK doesn't have any influence over the World Bank," I argued.

"BUT SHE'S A CORRUPTOR!" was the only rebuttle.  And then I noticed something.  In addition to not knowing much about the issue at hand, all of the young people were men.  And then I realized that this wasn't a protest at all, but rather an engineered political statement designed to resemble a protest.  This ersatz mass-movement is a common tactic in Indonesian politics, where popular discontent is a powerful tool, especially since the fall of strongman president Suharto in the late 90s.  These protest literally employ young men to shout slogans and carry inflammatory signs designed to impugn the character of whoever is the subject of the protest.  Protestors are paid around 30,000 rupiah (around $3.50) and are offered a free lunch for their participation.  This particular protest was organized by a political organization that shall remain nameless.

It was a pretty interesting thing to watch.  The paid protestors even offered me some lunch, but I refused since I'd already had my fill of rice and chicken sinews for the day.  We sat around shooting the breeze.  They were obviously in it for the food and the money, so I wasn't going to learn much about the allegations against Sri Mulyani.  So we talked about other things.

Keith: "Mana cewek?" (Where are the chicks?).

Protestors: "Di Mall..."  (at the mall...).

All: "HAW HAW HAW!"  (Haw Haw Haw). 

What made the day most interesting is that yesterday, on the flight from Singapore to Jakarta, I sat next to an Indonesian civil servant who had worked for 15 years as a banker specializing in international finance.  He told me about some of the intricacies of the Century Bank imbroglio (which are far too detailed and boring to get into here) and how difficult the whole thing is for your average Bambang to understand.  We then got into a discussion about how dangerous ignorance can be in a democracy.  We both agreed that lots of folks are swayed by simple explanations for incredibly complex problems, which makes the ultimate resolution of such problems that much harder to achieve.  It made me realize how blessed I am to live in a country where all the people are well informed when it comes to complex issues such as the national debt, taxation, and global warming.  It's because of this that we're able to elect leaders that do such a good job working together for the benefit of everyone!

On a lighter note, below I've included the picture of the day.  This photo is of Moon Base Epsilon, which, due to the failure to carry a one in complex orbital calculations, actually ended up being constructed in Jakarta.

Monday, July 18, 2011

Indonesia and the Demographic Transition?

Many people don't realize that Indonesia is the 4th most populated country in the world, after China, India, and the United States. Indonesia's population is young and growing, two factors that have long-term implications for policy-makers in the country.  A topic that frequently comes up in discussions of economic and social development is the role of population growth in increasing or decreasing the prosperity of a country.  Today we're going to have a look at some basic principles of population geography, including a model that is one of the mainstays of introductory human geography courses.  We'll examine the applicability of this model along with it's strengths and weaknesses, and then we'll try to apply the model to Indonesia.

source: wikipedia
Lesser developed countries, as a general rule, tend to have higher rates of population growth than more developed countries.  There are, of course, exceptions to the rule, but in general there is a pattern.  Have a look at the two maps I've included to the left.  The first is a global map of population growth.  The second map shows global figures for the Human Development Index, a measure the UN came up with to calculate development (1).  As you can see, areas with lower population growth tend to have higher human development indexes.

The problem with high population growth is that more people require the government to build more schools, health facilities, sewers, and a host of other social services.  If the population grows to rapidly, the government can't keep up and thus the overall standard of living decreases.  In addition, rapid population growth can outstrip the economy's growth, making it difficult for all of the new people to find jobs when they come of age.  Lack of employment or educational opportunities for a large younger generation can often lead to civil unrest (2).  In Indonesia government officials with the National Population and Family Planning Board (BKKBN) have raised concerns about potential problems related to overpopulation.  Sudibyo Alimoeso of BKKBN recently warned that if the population continues to grow at the current rate of 1.49 percent, it will reach 450 million by 2045.  Alimoeso warned taht a "grand design is needed for the revitalization of the national family planning program".  But how realistic are these concerns?

An Introduction to Population Geography

To analyze population change, it helps to be familiar with a few terms used by population geographers and demographers to describe the structure of a population.  Crude birth rate (CBR) refers to the number of babies born annually per 1000 people in the population, whereas crude death rate (CDR) refers to the number of deaths per 1000 people in a given year.  Thus CBR-CDR gives us the growth rate, since if you have more babies being born than people dying, the population will increase (3).  It turns out that if we look at the change of these numbers over time, a pattern emerges.

Warren Thompson developed a model to describe the progression from high growth to low (and potentially negative) growth in 1929.  He used observed changes in birth and death rates in industrialized countries over a period of 200 years.  What he found is that as countries industrialize and become wealthier, the death rate drops, followed by a later drop in the birth rate.  This model has come to be known as the Demographic Transition, and I've included a chart detailing it below.  In the demographic transition there are 5 stages (4), each with different fertility and mortality characteristics.

http://hs-geography.ism-online.org/2010/09/07/the-demographic-transition-model/
  1. Stage one.  The first stage is characterized by high birth and death rates.  Sometimes the death rate exceeds the birth rate; overall there is very slow population growth.  For most of human history we've been in stage one.  Because of the high death rates and the natural human drive to sustain the species, some population geographers have theorized the emergence of pro-natal values, or practices and beliefs that encourage childbirth.  This would include adolescent marriage, rigid gender roles, and fertility cults.  According to Demographic Transition Theory, every country in the world was in stage one until about the end of the 18th century.
  2.  Stage two.  In stage two the death rate begins a slow and steady decline (3).  This is due to improvements in food security brought about by agricultural advances as well as improvements in public health and better medical technology.  However, because pro-natal values have "inertia" and don't immediately disappear, the birthrate remains high, and so the population increases rapidly.
  3. Stage three.  In stage three the birth rate begins to decline since more children survive, and thus fewer babies are required to ensure a sufficient number "make it".  Although the birthrate is declining, since the death rate has not yet stabilized (it too is still falling), the population continues to grow relatively rapidly, but the rate of growth declines. 
  4. Stage four.  In stage four both the death rate and birthrate have stabilized at low levels, and so the population again experiences very low population growth, as in stage 1.  
  5. Stage five.  This stage was not part of the original model, because the conditions found in stage 5 couldn't have been predicted when the model was being formulated.  But demographers have noticed that in an increasing number of populations there are signs that the population is actually (or soon will be) decreasing.  This is because low fertility has predominated for several decades, and now the population is aging, and so there are more deaths than births.  This is not due to any deficiencies in healthcare or public safety, nor does it indicate the presence of natural disasters.  Rather the declining population is due to the historical development of the structure of the population itself. 
Currently Indonesia has a population of around 240 million people, with a growth rate of 1.49 percent.  Over the past ten years the population has grown by around 33 million people.  Growth at 1.49% is still growth, but it's not nearly as fast as some other countries.  So to figure out if the demographic transition model can be applied to Indonesia, I decided to look at the statistics (5).


Looking at these numbers we can make several observations.  In general, after 1905 there is a slow increase in the rate of population growth.  This would suggest that living conditions and standards of health and public safety were gradually improving.  There is a dramatic decline in 1945 and 1950, which is attributable to a decline in birth rates and an increase in death rates experienced during the Japanese occupation in World War II and the war for independence against the Dutch.  After 1950 the growth rate shoots up, which would be consistent with stage 2 of the demographic transition.  Then after 1970 the growth rate begins to decline, even though the population is still growing, which is consistent with stage 3 of the DT.  In addition, we have some anecdotal statistics concerning other indicators that suggest infant and child mortality along with fertility all experienced a dramatic decline over the course of 30 years.  The decline in fertility is consistent with stage 3 of the DT, whereas the declines in child mortality are more consistent with stage 2.  But overall the numbers seem to suggest that Indonesia has gone through most of the DT and is currently in stage 3. 

More than "pro-natal" values?

source: wikipedia
When comparing instances of the demographic transition across countries we tend to notice several differences.  Here I want to focus on how rapidly the CDR and CBR decline.  In European countries that first entered the demographic transition, we find that the decline in death rates is gradual, as in the example of Sweden to the right.  This is because advances in medicine and public health happened gradually; they had to be discovered over time.  However, in countries that entered the demographic transition later, we find that the decline in death rates is much steeper, meaning it happened much more rapidly.  Look at the graph of Sri Lanka to the left.  As you can see, there is a fairly dramatic decline in the death rate most notable in the 1940s.  This is because instead of discovering medical advances, technology can be shared, thus leading to drastic declines over the short term.  This has the effect of greatly increasing the rate of growth, because there is no corresponding decline in the birth rate.

We also find variations when we look at how rapidly the birth rate decreases.  In my experience, most explanations of the demographic transition have tended to overemphasize the role of pro-natal values, but it turns out there is more at work than this. Research over the past several decades indicates that the relative status of women in society is very important in determining the rate of decline.  Thus in Indonesia, where women have traditionally worked outside the home and have long had a larger role in "breadwinning" than some other countries, the birthrate seems to decline more rapidly, and so the period of high growth doesn't last as long.

What does all this mean for Indonesia?  Well it suggests that the population growth rate will probably continue to decline.  But does this mean the country should neglect its family planning program?  Of course not.  However, an understanding of demographic geography can help to design intelligent, forward-looking policies.

NOTES

(1)  The HDI looks at life expectancy, average years of schooling, and income per person.  It is thought to be a more comprehensive picture of development than economic indicators.


(2)  For an interesting and path-breaking exposition on the connection between large youth populations and civil unrest read up on the Youth Bulge, a concept pioneered by Professor of Geography Emeritus (and one of my mentors) Gary Fuller of the University of Hawai'i.


(3)  These numbers don't consider immigration. For an interesting take on migration and the demographic transition check out he Zelinsky Model of Mobility Transition. 

(4)  Most treatments of the demographic transition use 3 or 4 stages; recently the 5th stage has been added but isn't found in all texts.  I think the 5th stage adds to the explanatory value of the model, so I use it.  Some demographers are now suggesting that there is even a 6th stage in the demographic transition. 


(5)  In my spreadsheet you can see columns for year, population, growth rate, infant mortality, under 5 mortality, fertility, and some birth and death rates.  I calculated the growth rates based on the statistics I found.  Numbers in black (and green) come from a source I presume to reliable that draws information from Indonesian government statistics.  I highlighted some of the numbers in green though because those growth rates are averages over 20 or 30 years, and I consider those averages to be less-than-reliable.  Numbers in red are from the website of the Indonesian bureau of statistics.  Numbers in blue are from another website.  In general I doubt the reliability of pre-1950 census numbers for Indonesia, but I have seen analyses that suggest the colonial census takers were fairly rigorous in the 20th century.  

REFERENCES AND FOR FURTHER READING:

Dangalle, Nimal.  1982.  Demographic Transition in Sri Lanka.  Sri Lanka Journal of Social Sciences 5:2 pp1-29.  Found here.    

Nitisastro, Widjojo.  1970.  Population Trends in Indonesia.  Ithaca, New York: Cornell University Press.

Indonesia Bureau of Statistics

Saturday, July 2, 2011

The Ancient Kingdoms of the Indonesian Archipelago

As I look back on my last few postings I notice that I've tended to be a little negative about some things, and thus the casual reader might be distracted from the reality that Indonesia is truly an amazing place; a place well worth knowing more about. So today's post is going to be about some of the old kingdoms that form part of the rich and fascinating history of the country. These kingdom were heavily influenced by their geography, and so we'll use that as a starting point.

Southeast Asia is usually divided by geographers into two sub-region: mainland Southeast Asia (consisting of Burma, Thailand, Laos, Cambodia, and Vietnam) and "insular" or maritime Southeast Asia (consisting of the island states of Indonesia, the Philippines, Brunei, and Malaysia). Geographers make generalizations about the two sub-regions; mainland SEA has mountain-lowland divisions, long rivers that promote rice cultivation, and are populated by speakers of languages from the Mon-Khmer, Sino-Tibetan, and Thai-Kadai language families, whereas insular SEA cultures tend to be more ocean-oriented, with people speaking closely-related languages of the Malayo-Polynesian family. In general societies of mainland SEA have been more inward-looking, whereas those of insular SEA have long had contact with other realms.

The Geography of Empire

For a significant portion of recorded history, two of the richest (in terms of culture and material wealth) poles of civilization have been China and India. Trade between these two regions emerged thousands of years ago and at various stages involved other areas as well, including Persia, Rome, Europe, and others, but much of the trade occurred over land via tortuous and dangerous trade routes through Central Asia. Sea trade between India and China was hampered by the Malay Peninsula, a more than 1000 kilometer long finger of land extending from what is now Thailand and Burma down to the island of Singapore. Goods had to be portaged across the isthmus (1) of Kra. However, sometime around the 4th century A.D. Malay sailors developed an all-sea route between India and China. This new route was a faster way to transport silks from China to the western regions. The cultures of the Malay Peninsula and the island of Sumatra only had to offer port facilities and safety from pirates for trade to flourish along the new route. They also introduced new goods to the world market, including cloves, nutmeg, and mace. These spices, most of which only grew on certain islands because of very specific climate requirements, became extremely profitable for the people of the islands of what would become Indonesia. Trade in spices and control of the narrow sea lanes of the Strait of Melacca gave rise to the first of the great ancient kingdoms of the Indonesian archipelago, Sri Vijaya (Sriwijaya).

Sri Vijaya, which means "glorious victory", emerged during the 6th century around present day Palembang on Sumatra. Sri Vijaya was originally one of several small riverine kingdoms athwart the trading route on the coast of Sumatra. Each of these small kingdoms centered on a river; the inhabitants downstream provided port services and sometimes coerced passing ships into anchoring and paying taxes. They also served as collection points for goods produced upstream. It's not certain how Sri Vijaya came to dominate its neighbors, but some historians speculate that the large area of the fertile valley of the Musi river helped the Sri Vijayans produce more food, which in turn enabled them to support a large navy. For five centuries the Sri Vijayans controlled the China trade, with goods such as porcelain, jade and silk from China, textiles from India, and sandlewood, spices, and resins from the Moluccas. One ancient traveler's account of Sri Vijaya saya that the kingdom was so rich, every year the king's subjects would throw bricks of gold into the river as an offering (2). Sri Vijaya was an important center for Mahayana Buddhist learning, and monks from as far away as China and India came there to study.

Sri Vijaya is an example of a maritime empire. The kingdoms that emerged in Indonesia consisted of two types: thalasocracies like Sri Vijaya, whose rise and fall depended on trading relations and strong navies, and the inland, rice-producing states that emerged mainly on the island of Java. The latter weren't as involved in trading but rather developed sophisticated agricultural societies. The first major example of the rice kingdom, Mataram, arose in central Java around the middle of the 8th century. The Mataram rulers built the Dieng temples I mentioned in a previous post before moving east to the area around present-day Jogja. Mataram is not the original name of the kingdom but rather refers to the geographic area around Jogja (3). The Mataram kingdom collapsed in the 11th century due to military pressure from Sri Vijaya.

The greatest empire of insular Southeast Asia, Mahapahit, emerged out of the decline of another kingdom in the 13th century. Majapahit ("bitter fruit") ruled over much of what is now Indonesia and the Malay Peninsula. Through cunning the founder of Majapahit, Vijaya, manipulated an invading Mongol fleet of 1000 ships and 20,000 soldiers (4) into eliminating his rivals before turning on them and driving them out of Java. Majapahit gave rise to two heroes of Indonesian history that are still revered today. The first of these, Gajah Mada, served as prime minister (patih) and regent from 1331 to 1364 and greatly expanded the rule of Majapahit, extended authority to neighboring islands. One of Indonesia's major universities (Universitas Gajah Mada) in Jogja is named for him. The second major figure is Hayam Wuruk, who worked with Gajah Mada to expand the empire. Hayam Wuruk is known as a patron of the arts and an avid performer of traditional Javanese music and dance. The fact that Majapahit controlled most of the islands that would become Indonesia was used as evidence by independence leaders such as Sukarno (5) that there was a historical precedent for the nation of Indonesia.

This is just a short introduction to the many kingdoms that have emerged in Indonesia over the past 1500 years. There are many others, including Tarumanagara, Jambi, the Sailendras, and Singhasair. They all have fascinating stories and all contributed to the rich historical heritage of Indonesia.

(1) An isthmus is a narrow piece of land connecting two larger areas of land. Can you use a world map to find other isthmuses?

(2) According to Shaffer (see reference below), when the king died his successor would dredge the gold out of the river and distribute it to influential members of court to cement support during the transition.

(3) One should take care not to confuse this earlier Mataram kingdom, which was a Hindu kingdom, with the later Mataram Sultanate, an Islamic kingdom that emerged in the 16th century.

(4) The fleet had come to punish Vijaya's father, Kertanagara, king of the defunct Singasari kingdom, because Kertanagara refused to pay tribute to Kublai Khan, who had recently become emperor of China.

(5) Sukarno would go on to become Indonesia's first president.

REFERENCES AND FOR FURTHER READING

SarDesai, D.R. 1997. Southeast Asia: Past and Present. Boulder, CO: Westview. 422pp.

Shaffer, Lynda Norene. 1996. Maritime Southeast Asia to 1500. Armonk, New York: M.E. Sharpe. 121pp.

Wednesday, June 29, 2011

Air Asia: "At Least We Didn't Crash!"

Man what a day I had yesterday. On my last full day in Indonesia I was forced to travel from Jakarta to Jogjakarta to get a re-entry permit so I could come back without having to endure the several-week-long nightmare I'm going to detail in the next post I write. My flight out of Jakarta for Taiwan was scheduled to leave at 2.20pm the following day. So I booked a flight on Air Asia at 8 in the morning, scheduled to land in Jakarta at 9am. I had left my bags, including my computer, all my clothes, and everything else at my buddy's apartment, figuring that I would surely have enough time to retrieve them and return to the airport. I was only going to be in Jogja for the day, and the stingy b*%&!@s at Air Asia charge you for checked baggage.

I arrived at the airport and everything went smoothly. I fell asleep as we were taxiing down the runway. When I awoke we were landing, and I thought to myself "man that was quick", and was getting all set to get off the plane when I noticed that we were landing back in JOGJA. "NOOOOOOOOOOOO!!!!!!". It turns out that someone had forgotten to flip a switch or check the oil or something. So they called their engineer, and within about 20 minutes the plane was ready. Still time to do what I need to do. But guess what? The Indonesian Air Force Academy, which uses Adi Sucipto airport in Jogja, at that moment was having some sort of exercise, and they closed the airport for 30 minutes. So we had to wait. And wait. And when the airport finally reopened (after an hour) the Air Asia folks discovered something else wrong, and so we had to sit on the tarmac for 30 more minutes. All tolled we got to Jakarta at around noon, 2 hours 45 minutes late, leaving me not enough time get to Kuningan to get my bags before my afternoon flight (1). What was I going to do? My computer, my clothes, my phone, my keys, everything...gone.

However, in this life if you spend any more than 2-3 minutes feeling sorry for yourself before setting about to address the problem you're just digging a deeper hole, making it harder to eventually put the whole thing behind you. So I tried to figure out how I might be able to engineer the transport of my luggage to the airport. Of course, all the plans I came up with failed. So eventually I came to the tough conclusion that I was going to have to leave everything in Jakarta and pick it up when I get back in August. At first this seemed like an impossibility, but then as I thought about it became clear to me that there's nothing there I can't live without. The computer is probably the most inconvenient, but fortunately I brought a backup harddrive just incase I needed to access any data in Jogja. I've got an extra set of keys in Honolulu, and the phone, well, nobody calls me anyway. So I'll be alright. But it's definitely inconvenient, and there will be hundreds of small problems that crop up over the next couple of weeks because of this. I'm still alive, though, and I'm going home, which is the important thing.

I don't know why I put any faith in Air Asia in the first place. Because if something can go wrong here, it will. That's no joke. Airline management in Indonesia is so bad it's comical. But I still fly (because I have to), and for some reason I still expect them to be on time. I think to myself "it can't happen again, can it?" But it does. The problem is that the standard of service is so bad, it's so beyond your expectations in a bad way that your brain just can't cope with the crappiness of it. Hope springs eternal and despair is born anew.

So as a public service to all the would-be travellers, I've created the following guide to airlines in Indonesia. You can use this guide to pick the appropriate airline consistent with the level of misery, discomfort, and inconvenience you want to experience. Here goes:

Air Asia: A budget airline operating out of Singapore or Malaysia (what's the difference?). Among the cheapest, and probably among the most reliable, but I hate them. Plus they are arrogant ("Now Everyone Can Fly"; "The Best Airline in the World!") and they have sneaky ways to trick you into paying additional charges on their website.

Batavia is a big Indonesian carrier. I've flown with them a couple of times, and they seemed to be okay; only one of the two flights was late.

Garuda: Overpriced and undercleaned. This is Indonesia's "flagship carrier". Of course, they're not allowed to fly planes to Europe or the US. Hmmmm....

Lion Air: Lion Air is a budget option and they have frequent flights, but they are late about 80% of the time (in my experience) and their prices fluctuate wildly within hours. Still, as near as I can tell, this maybe the most popular carrier in Indonesia

Mandiri: Not bad. Comparable to Batavia.

Merpati: Crashes frequently. 'Nuff said.

Sri Vijaya: I've never flown SV, but chances are they suck.

Wings Air: Chances are if you have to go out to the eastern portion of Indonesia you'll be flying on one of Wings' turboprops. They are okay, but the planes smell funny and make odd noises.

But thank God for Taipei. That's where I am now. I think I mentioned in a previous post that China Air books transit passengers without charge in the Novatel near the airport if there is room available, and thankfully this time there was. The Novatel claims to be "5-star", but to tell you the truth it's probably closer to 4.6. They are seriously lacking in gold-leaf accoutrements. But it will do in a pinch. So I traded in some dollars for Chang-Kai-Sheckles (2) and made my way over to the hotel. After a good night's sleep I woke up to enjoy the wonderful complementary breakfast buffet, which includes as much bacon as you can eat.

Now I feel much better and the world doesn't seem so out to get me as it did before. It's important to focus on the positive things, like big mountains of bacon and the free nippers of 15-year-old scotch you can sample at the airport here. So bearing that in mind, I've come up with a new model for my new arch-nemesis Air Asia: "At Least We Didn't Crash!"

(1) Probably the funniest thing about this is that the Air Asia cabin crew had the gall to charge people for refreshments and food after causing them to sit in the hot airplane in Jogja for 2.5 hours. Nice, eh? High-class folks, those Air Asia peeps.

(2) Chang-Kai-Sheckles (CKS) is the currency in Taiwan.